Simulate Pseudo CSS Classes
:hover or :active can be tricky because you can’t always use your mouse. In DevTools, you can easily simulate these states without any hassle. Simply inspect the element and click the :hov button to enable the desired pseudo-class. 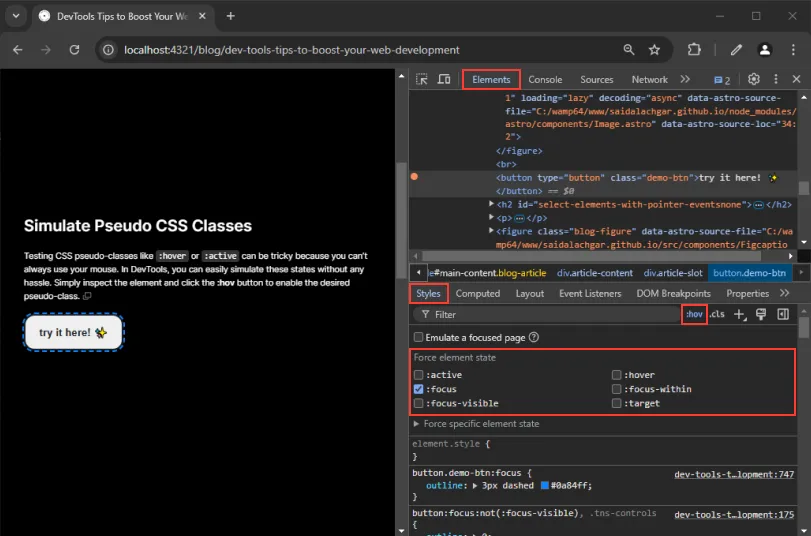
Select Elements with pointer-events:none
pointer-events:none CSS property. 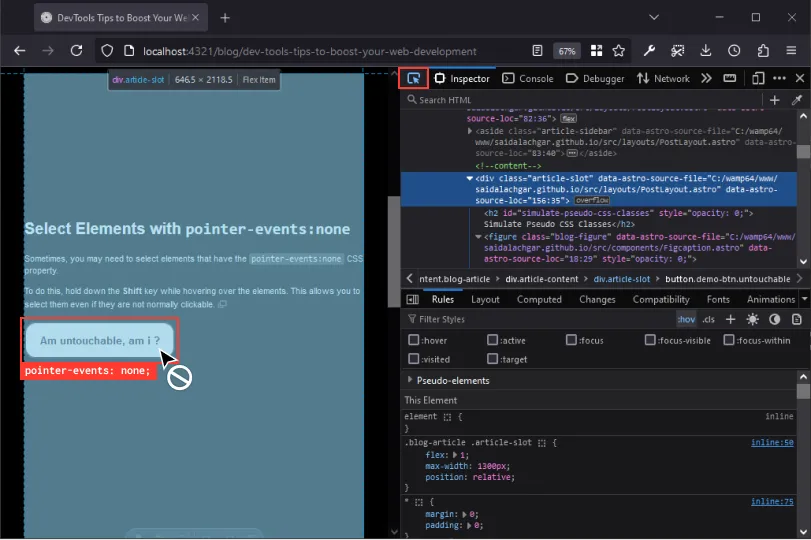
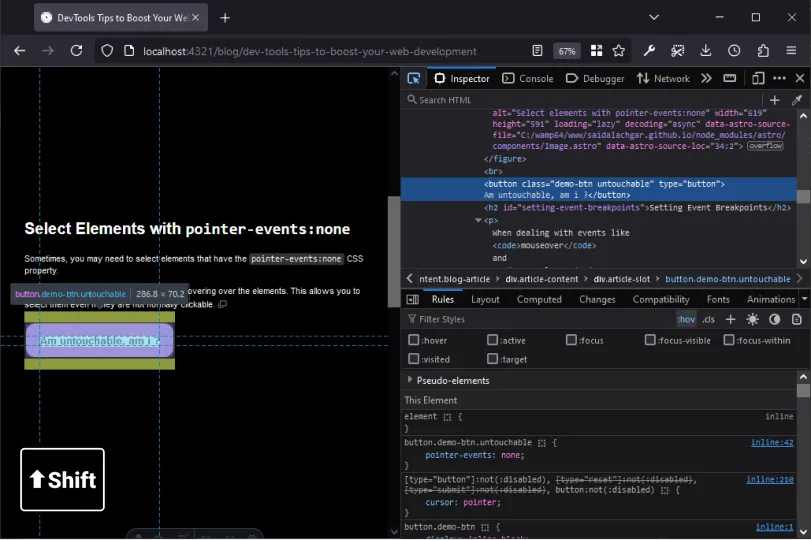
Setting Event Breakpoints
When dealing with events like mouseover and mouseleave, you can set breakpoints in the Debugger tab of DevTools to pause your code at the exact moment an event is triggered.
For example, if you have a dropdown menu that is created on mouseover and deleted on mouseleave, setting a breakpoint on the mouseover event allows yout to work on your menu without being bothered.
The advantage here is that even if you leave the hoverable item, the menu won’t hide immediately because the browser pauses the execution. You can resume the code by clicking the Play button in the Debugger when you’re ready to continue.
Zoom the DevTools UI
If you find the DevTools interface too small, you can zoom in or out. Click inside the DevTools and use Ctrl + + to zoom in or Ctrl + - to zoom out and Ctrl + 0 to reset (use Cmd on a Mac).
Find and Export CSS Changes
After modifying CSS in DevTools, you can save your changes.
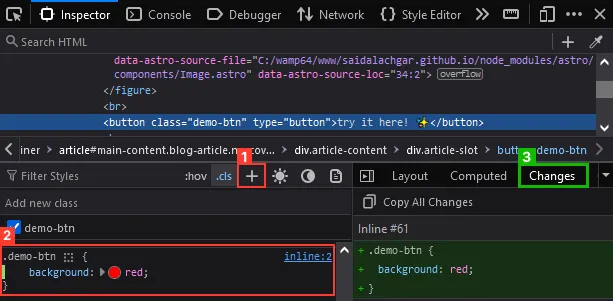
Ctrl + Shift + P. 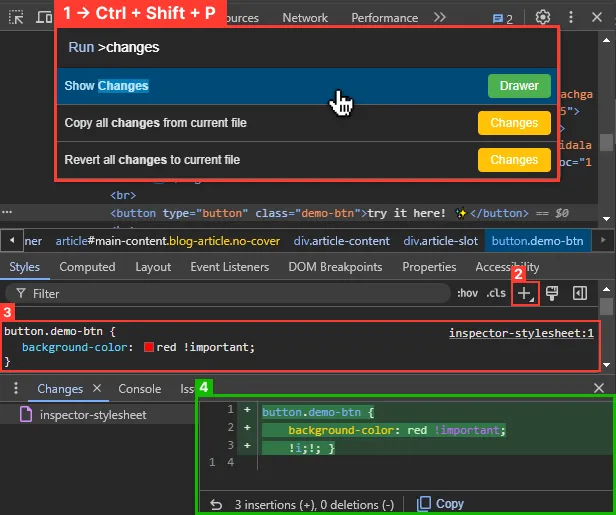
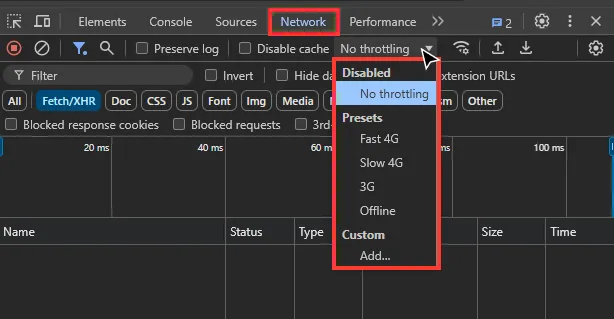
Test Slower Network Speeds
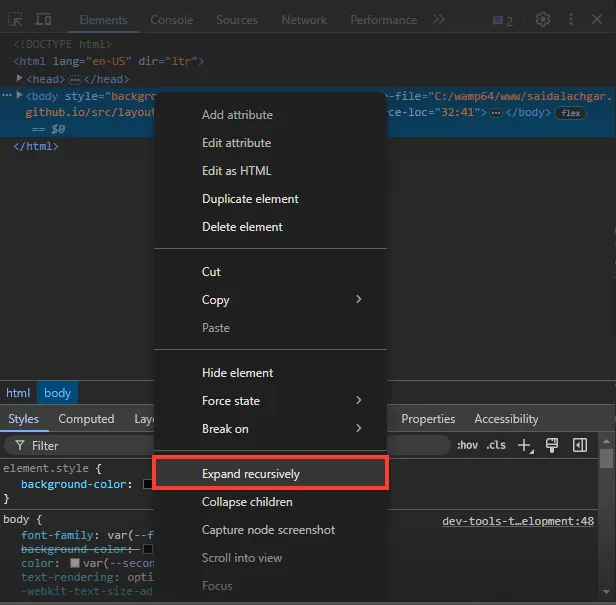
Expand DOM Nodes Recursively
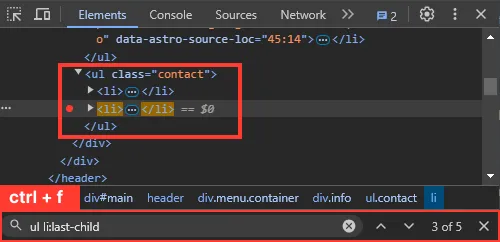
Search by Selector
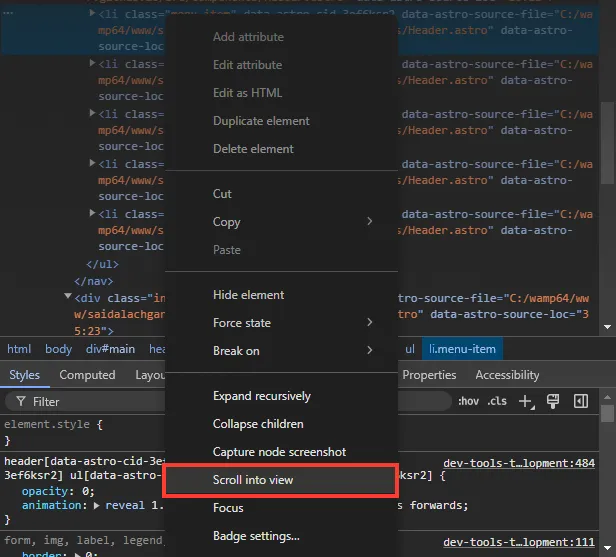
Scroll Element into View
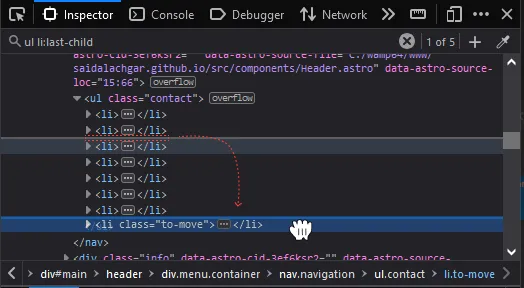
Drag and Drop Nodes
That’s all for now!
These tips can help you navigate DevTools more effectively, saving you time and effort while developing your web applications. Happy coding!